Lab 4 ITN 103
Step 1 Creating a Server Baseline
Step 2 Generating Traffic.
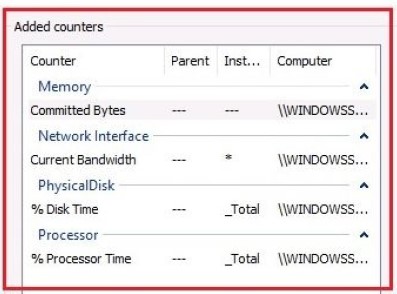
Collect RAM utilization (Memory Available MByptes)
Collect disk read-and-write operations (PhysicalDisk Disk Time)
Network Interface (Bytes Total - AWS PV Network Device)
Step 3 Performance Data Logs
To create data logs in Windows Server 2019, complete
the following steps:
1. With Performance Monitor open, expand Data
Collector Sets and select User Defined.
2. Right-click User Defined and select New Data
Collector Set.
3. Enter the name for your Data Collector Set.
4. Choose the Create manually (Advanced) option and
click Next.
5. Choose the Create data logs option and the
Performance counter sub-option, and then click Next.
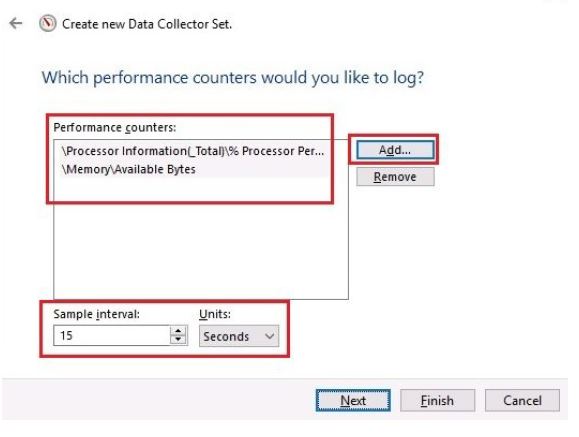
6. Click the Add button to add counters, as in Figure
below, specify the time interval, and then click Next:
7. Check that the default folder for saving data logs is the PerfLogs folder,
and then click Next.
8. Set the user in Run as, and select the Start this data collector set now
option.
9. Click Finish.
10. Are you able to see any logs in the C:\PerfLogs folder? Show me the file
in the C directory.
Download this Lab and answer the questions asked, comment on the procedures and make sure to add a conclusion. Upload to Canvas under the module for this lab.